Simple startup profiling of OSGi applications
Prompted by a colleague's question about profiling the startup time of Apache Sling systems, I vaguely remembered writing something a while ago, but couldn't find it immediately.
Funny how one's memory works - it took me a while to find it again, but I did indeed write an OSGi events recorder + timeline utility in SLING-1109.
That utility has since moved to the Apache Felix webconsole events plugin bundle, which is included in the Sling launchpad and thus was right here under my eyes.
Here's how you can use that webconsole plugin to get a simple timeline of an OSGi system's startup:
- Install the
org.apache.felix.webconsole.plugins.eventbundle in an OSGi app where the Apache Felix Webconsole is active. - Set that bundle to a low start level, say 1 or 2, so that it's activated early and captures as much startup events as possible.
- Configure the events recorder at
/system/console/configMgr/org.apache.felix.webconsole.plugins.event.internal.PluginServlet, setting the number of events to capture high enough to record your app's startup. - Start your app.
- Look at the startup timeline at
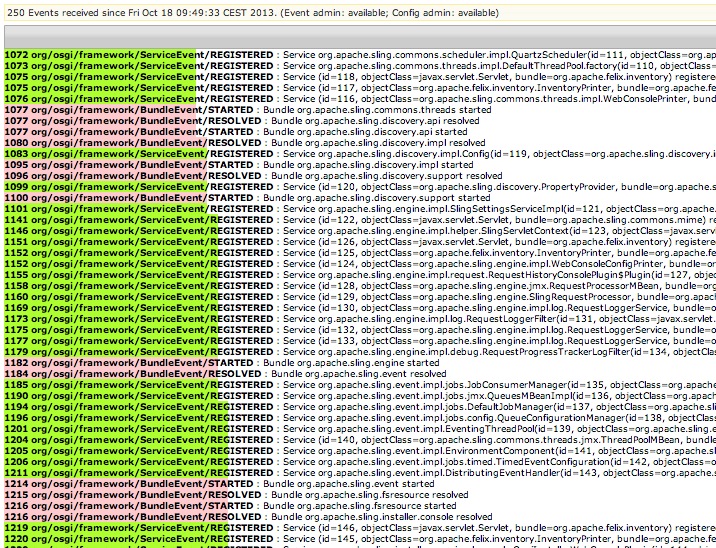
/system/console/events
This provides a simple graphical timeline, as shown on the screenshot below, that's especially useful in detecting outlier bundles or services that take a long time to start up.
